The calculation method described in the following is not to be applied to Austrian federal schools ("UPIS schools") and schools in Luxembourg administered by MEN.
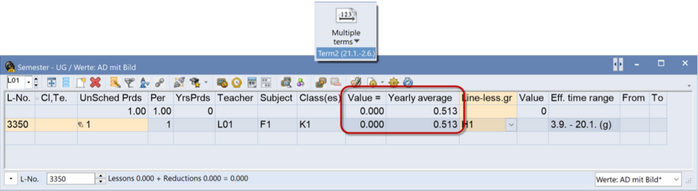
Let’s go back to teacher LH1 from the section above. He has only one lesson taking place in the first half year:
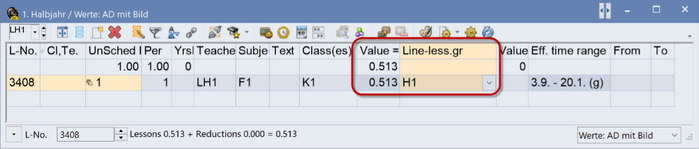
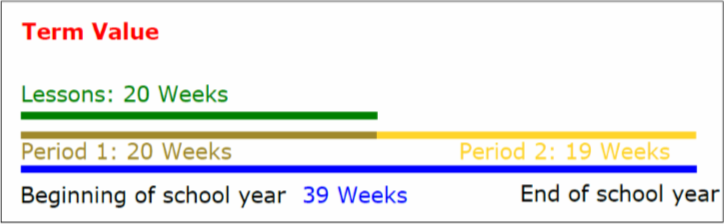
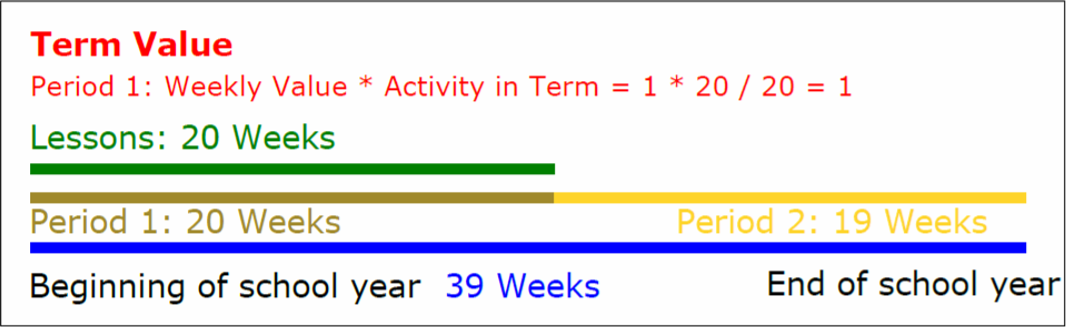
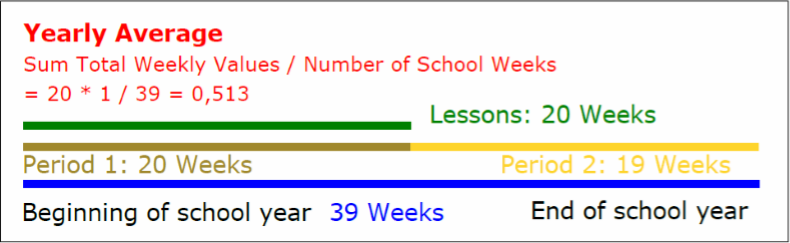
It has already been explained why the yearly average calculated by Untis is 0.513. If we divide the school year into two terms for additional restriction via the lesson group, the first term of which is identical with the duration of the first half year and the second term identical with the second half year, the lesson will then take place 100% in the first half year and 0% in the second half year.
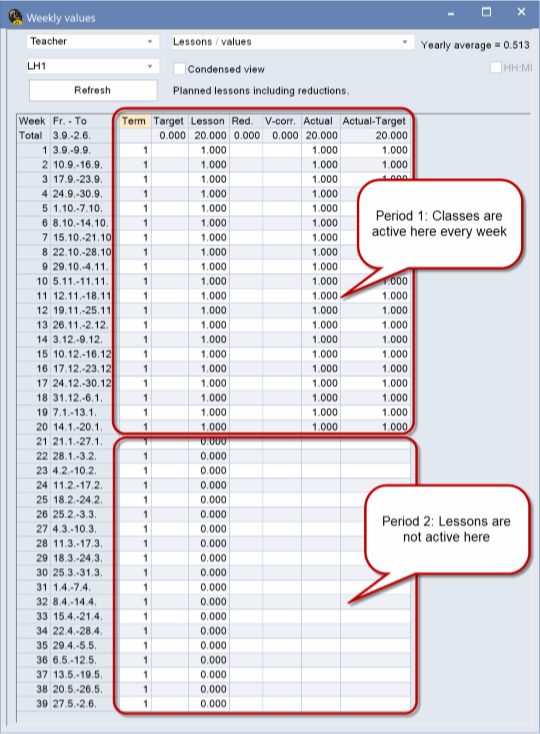
This is exactly the method which is applied to the value of the lesson to show it in the “Lessons” window, i.e. term-related.
In the first half year, the lesson is active in every week, the number of weekly periods is “1”, and the weekly value has not been changed at all. Thus, the term-related value “1” is shown.
In the second half of the year, the lesson is not active at all, therefore the term-related value in this term is “0”.
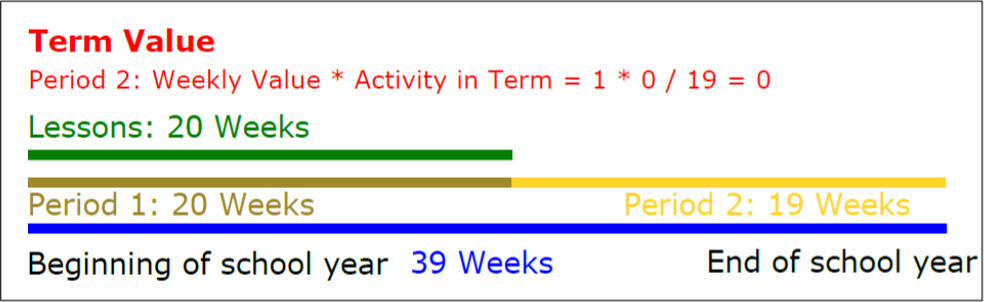
Please note that the average yearly value has not been changed in this graph. It is always and in all cases 0.513.
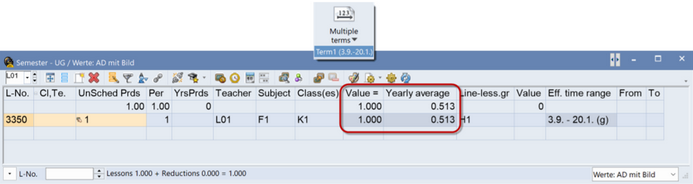
Note
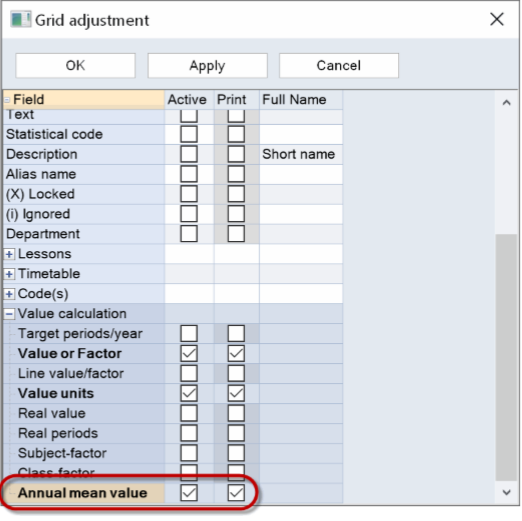
If you have already been working with Untis for a longer time, it could be that the "Yearly average" field is not yet shown in your lesson view. In this case you need to activate it via thebutton.
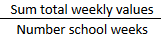
In general, the term-related value of a lesson is calculated as follows:
![]()
As stated in the previous section, the weekly value is, roughly speaking, the value for the respective lesson shown in the weekly value window.
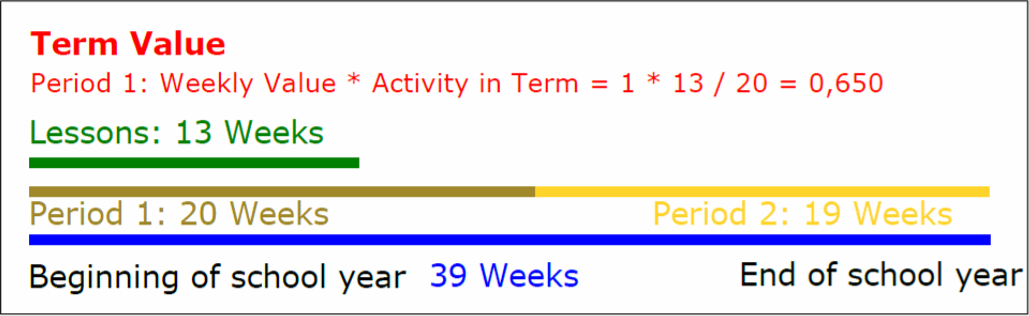
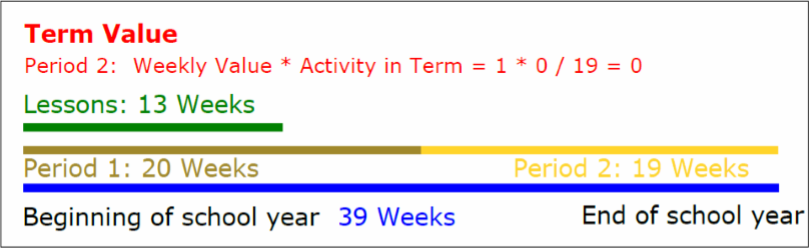
Let’s get into more detail with the example of a teacher who only has one lesson which is only active in the first 13 weeks of the school year.
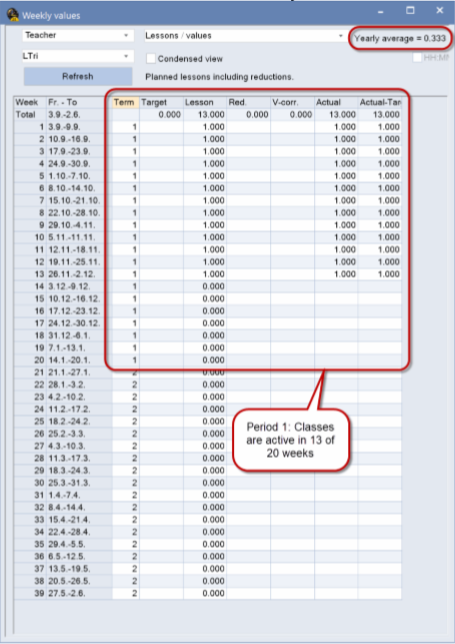
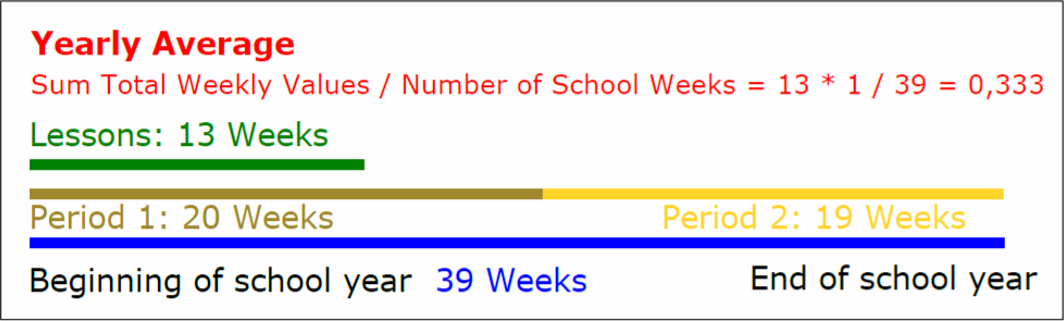
Teacher LTri’s lesson is active in total 13 out of 39 weeks (of the school year). Its average yearly value is thus calculated as follows:

![]()


![]()
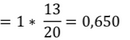
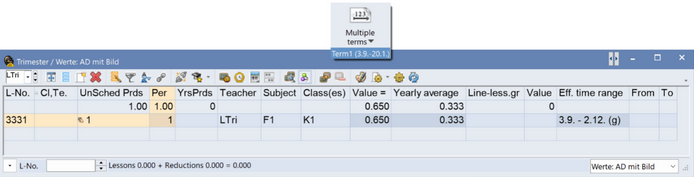
In the first term, the term-related value of this lesson accounts for:
![]()
![]()
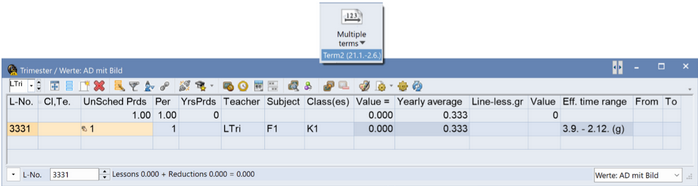
In the second term, the lesson is not active at all, therefore the term value accounts for:
![]()
![]()
The benefit of a term-related depiction is that the load of the teacher in the current term is shown more transparently. As a scheduler, you usually want to avoid a situation where colleagues teach 50 periods per week in the first half year and none in the second half, which would result in 25 periods on average, i.e. the average load.
Please note that the totals row of the "Yearly average" column shows the sum total of the displayed row values, and thus does not always correspond to the teacher's actual yearly average. It is possible that a lesson which contributes to the actual yearly average of a teacher does not exist in the active term, and therefore does not appear in th lesson list.
This was the description of a simple case where the individual weekly values have not been changed manually, and therefore they always show “1” for one-period lessons. It gets a little bit more complicated if, for instance, a factor is entered into the field of the same name of the lesson group window and the individual weekly values are manipulated (by defining an average yearly value).