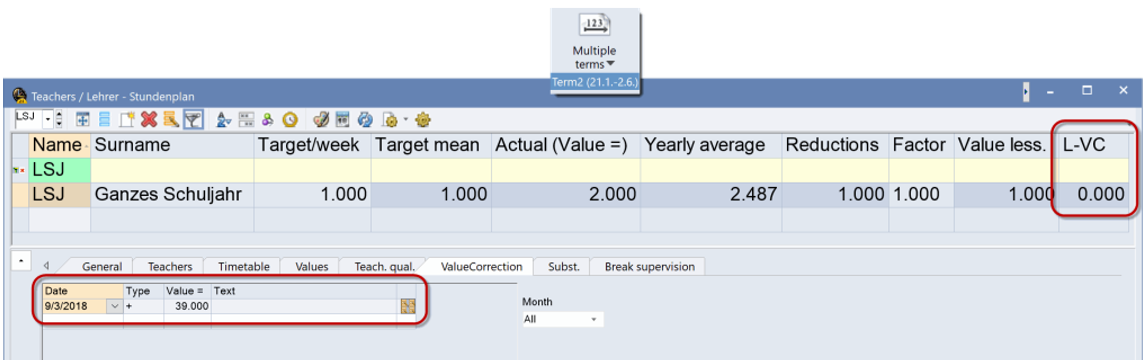
In the grid view of the teacher master data, value corrections are shown in the term it belongs to regarding date.
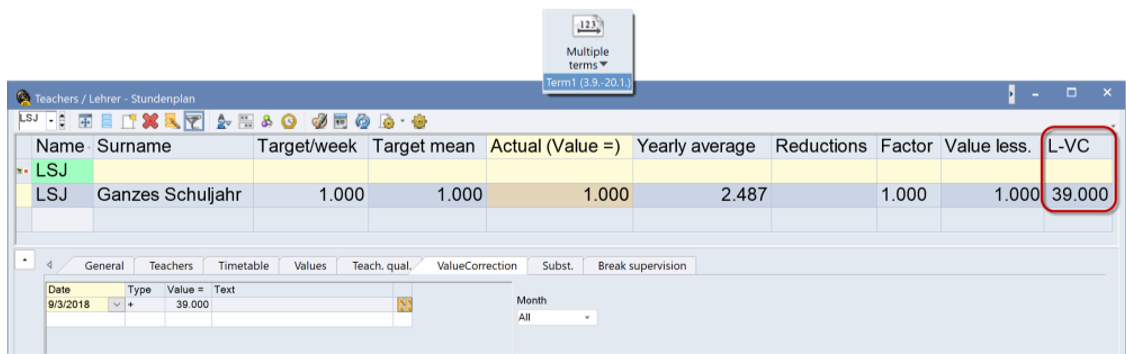
The grid view always displays all entries regardless of the date.
In the weekly value window, the value corrections are displayed in those weeks where they were entered.
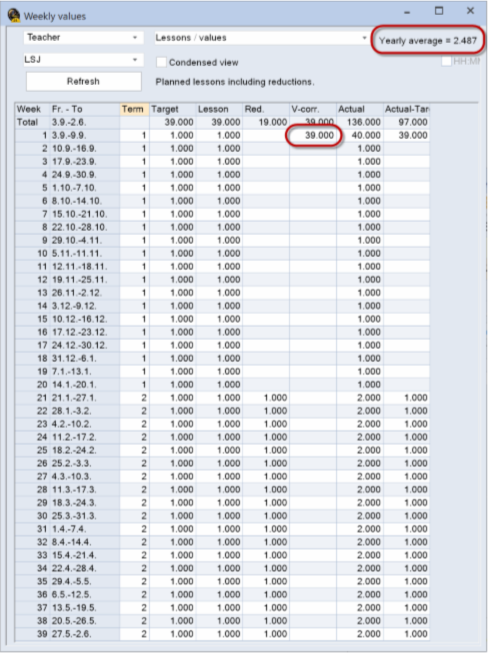
Please note that
1. only value corrections of types “+” and “–“ are taken into account,
2. the yearly average is calculated via the sum total of the individual entries / number of active school weeks.
In the above example, the value correction of 39 contributes to the yearly average by value 1 in 39 school weeks.